Querying
Observability
Observing queries
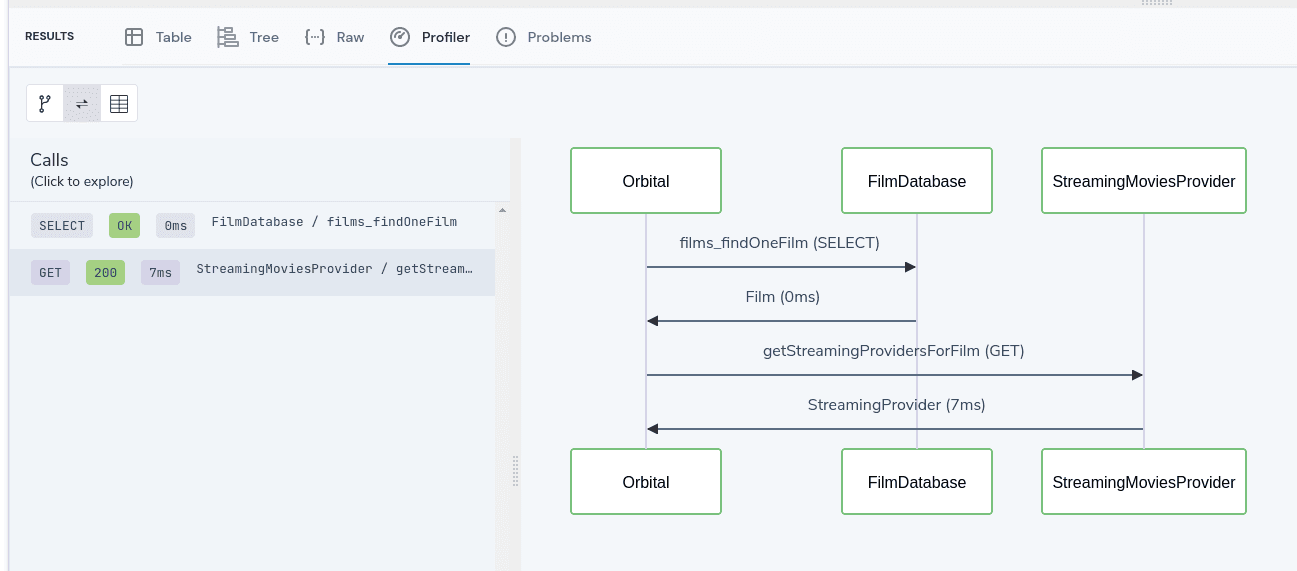
As queries are executed by Orbital, full call histories are captured and persisted
This gives rich debugging tools to understand exactly how a query was executed, which services were called and what they returned.
Configuring what's captured
The level of detail captured by Orbital can be configured at startup, and entirely disabled - if so desired.
When fully enabled, the following detail is captured and written to a database:
- Requests and Responses sent to services - such as APIs and Databases
- Metadata - such as URLs, response times, payload sizes, response codes and headers
- Message payloads for streaming event sources such as message brokers
- Variations of the above data to build query plan charts visualised in the Orbital UI
The following options can be passed as parameters or configured as environment variables to control the level of data that is persisted.
| Param | Description | Default |
|---|---|---|
vyne.analytics.persist-remote-call-responses | Defines if responses from remote queries are persisted to the database | true |
vyne.analytics.max-payload-size-in-bytes | The max payload written to the database per response | 2048 |
vyne.analytics.persist-remote-call-metadata | Should metadata (url, response codes, call durations) be persisted | true |
vyne.analytics.persist-results | Should query results be persisted | true |
Performance metrics - Prometheus
Orbital publishes metrics available for prometheus to collect.
If Orbital is connected to a Prometheus endpoint, performance data is made available in the Endpoints UI.
Streaming queries
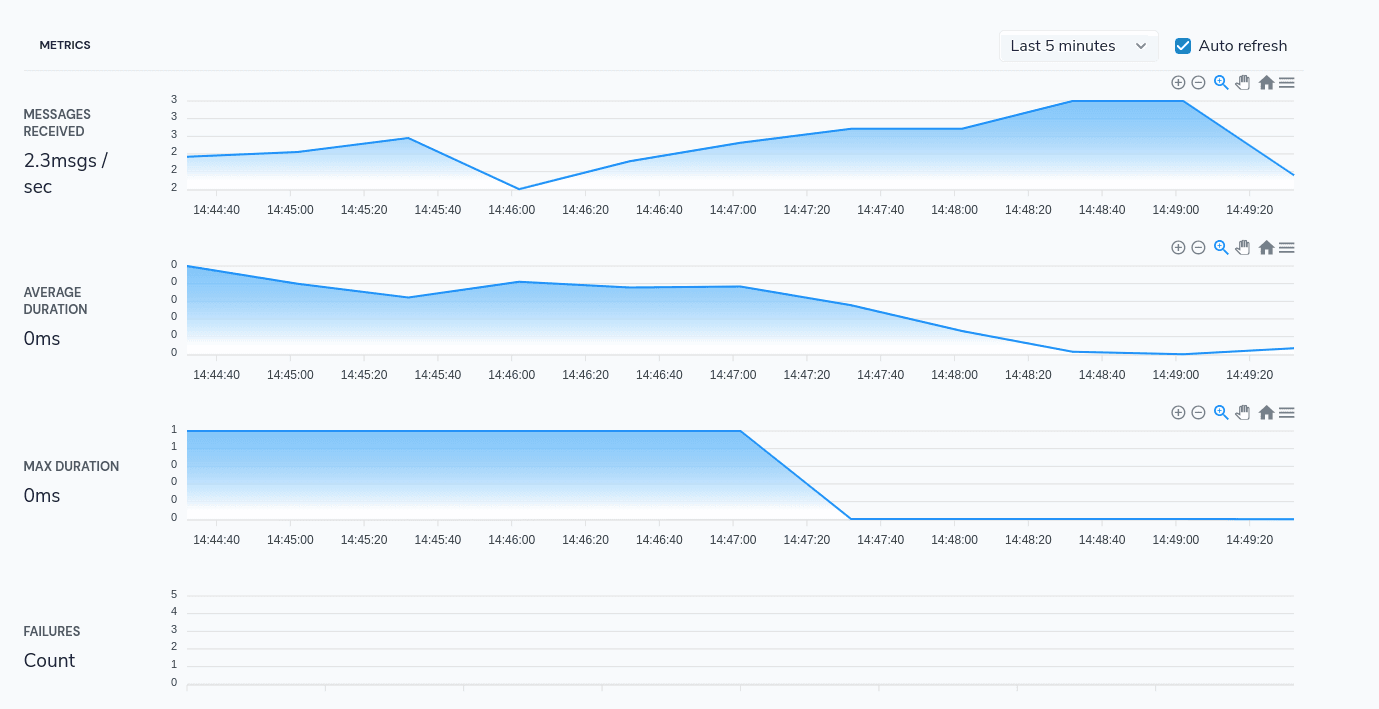
The following metrics are published for persistent queries (both streaming and request / response queries)
- Count of requests processed
- Processing duration
- Error Counts
Prometheus can then provide this data in histogram, providing min / max and averages
Configuring Prometheus
An example prometheus configuration is shown below
   - job_name: 'Orbital Metrics'
     metrics_path: '/api/actuator/prometheus'
     scrape_interval: 3s
     static_configs:
        #        172.17.0.1 is the ip address of localhost
        #        from within docker
        - targets: ['172.17.0.1:9022']
          labels:
             application: 'Orbital'